Your app's revenue potential heavily depends on how well you understand and apply TAM (Total Addressable Market) to pricing strategies. Here's why:
To succeed, calculate TAM using methods like top-down (industry data), bottom-up (your app data), or value theory (user willingness to pay). Then, break it down by geography, adjust prices based on local purchasing power, and use tools like Mirava to automate updates. This approach helps turn price-sensitive regions into profitable markets while maximizing revenue in high-income areas.
TAM Calculation Methods for App Pricing Strategy
TAM, or Total Addressable Market, represents the total annual revenue your app could generate if it captured 100% of a market with no competition. It's essentially the upper limit on your potential earnings [5]. For example, if you're creating a meditation app and the global market for meditation apps is valued at $6 billion, that figure becomes your TAM [8]. Understanding TAM is critical for setting revenue goals and refining regional pricing strategies for different markets.
Take this example: if downloads in India are high, but conversion rates are five times lower than in the U.S., it might point to a pricing mismatch. Jacob Rushfinn, Founder of Rushfinn Consulting, explains:
"If your conversion rate in India is five times lower than in Canada, Australia, or US, well, there's some mismatch... that can be an easy signal [of a pricing opportunity]." [9]
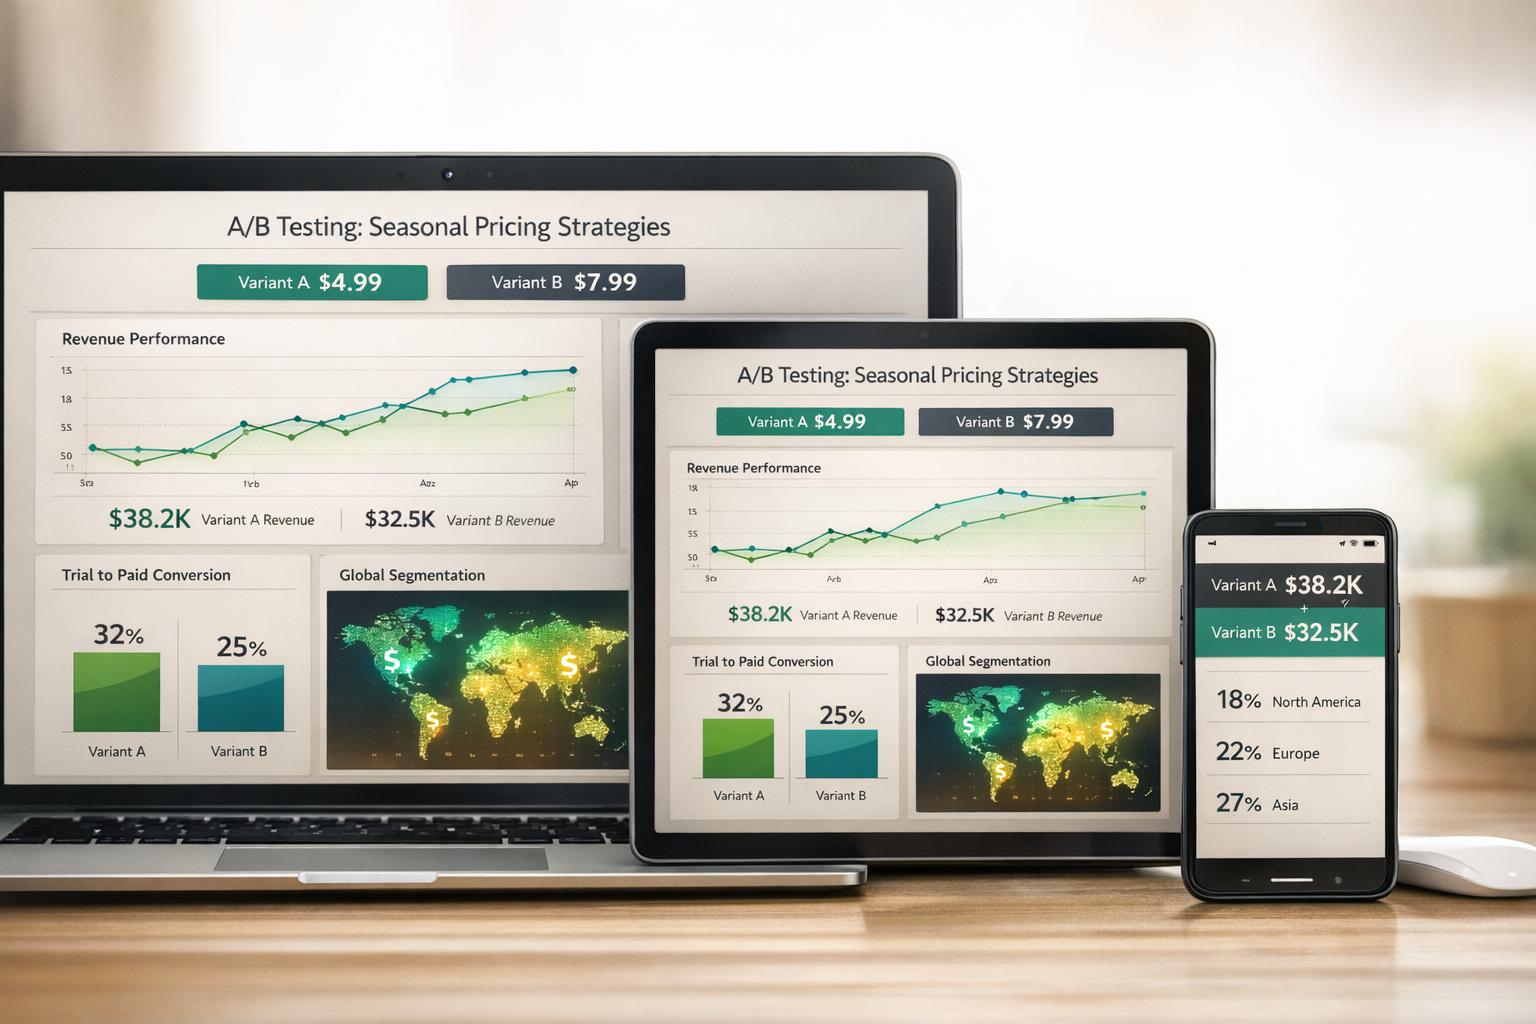
TAM also influences whether a chosen monetization model will work in a particular market. For instance, a subscription-only model might thrive in a large TAM market like the U.S., but smaller regions may require hybrid approaches, such as combining ads with in-app purchases, to generate meaningful revenue [1]. The global wellness apps market was valued at $11.27 billion in 2024, with the meditation segment expected to grow to $7.25 billion by 2033 [1]. These figures can guide decisions about where to focus localization efforts and how to adjust pricing strategies. To ensure these adjustments are effective, developers should test regional pricing using A/B experiments before a full rollout.
Breaking TAM into smaller components like SAM (Serviceable Addressable Market) and SOM (Serviceable Obtainable Market) helps turn global estimates into actionable regional goals [8]. This breakdown is essential for understanding TAM calculations.
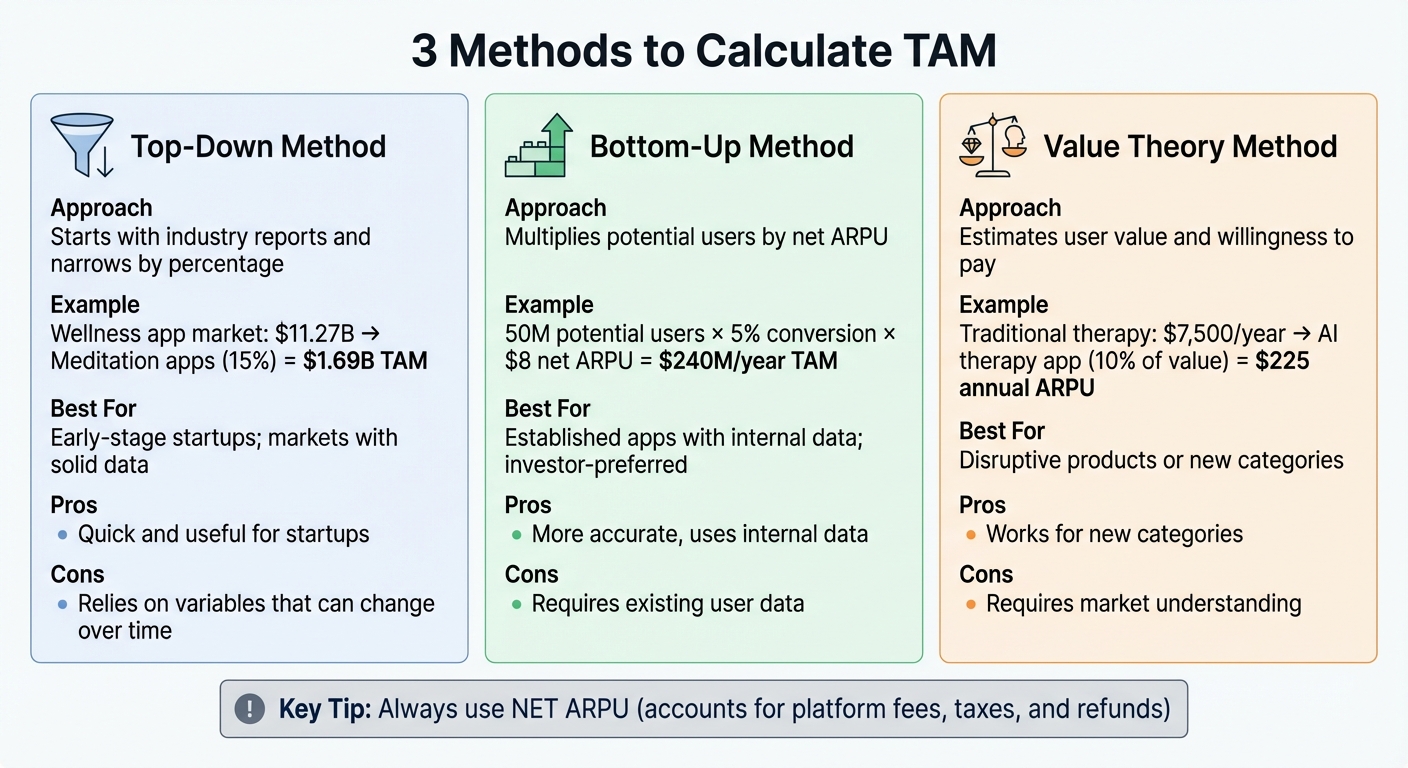
Here are three methods to calculate TAM, each offering unique insights for pricing decisions.
| Method | Approach | Best For |
|---|---|---|
| Top-Down | Starts with industry reports and narrows by percentage | Early-stage startups; markets with solid data [5][7] |
| Bottom-Up | Multiplies potential users by net ARPU | Established apps with internal data; investor-preferred [5][8] |
| Value Theory | Estimates user value and willingness to pay | Disruptive products or new categories [5][6] |
When calculating TAM, always use net ARPU, which accounts for platform fees, taxes, and refunds [8]. A common pitfall is "sizing the problem instead of the market" - assuming everyone with a problem is a potential customer, even if they're unlikely to pay [5]. Rob Cheng, Founder and Startup Marketing Advisor, offers this advice:
"A few birds in the hand is worth billions in the TAM. Early-stage startups shouldn't worry too much about calculating a precise TAM... investors care a lot more about the traction you can show with paying customers." [5]
When it comes to pricing apps, understanding your Total Addressable Market (TAM) is essential. Regional pricing strategies need to reflect not only the market size but also the local economic realities. A larger TAM, like the U.S., allows for lower prices to attract volume, while smaller markets often require higher per-user revenue to stay viable. However, even in large markets, local purchasing power can limit how much revenue you can generate from each user.
Take Netflix as an example. In the U.S., a standard plan costs $17.99/month, but in India - where user numbers are high but purchasing power is comparatively lower - the same plan is priced at just $5.62/month [11]. That’s a massive 69% price cut, reflecting the fact that a one-size-fits-all price would exclude millions of potential subscribers. In fact, Netflix estimates that fixed global pricing could block access for up to 85% of its potential users [12]. This highlights how TAM size and local conditions shape pricing and monetization strategies.
Competition adds another layer to this equation. In highly competitive markets like India or Brazil, companies often need to cut prices drastically to match local purchasing power. For instance, Flo Health saw "hundreds of percent" year-over-year revenue growth in Brazil after adjusting prices to local conditions, turning the country into one of its top three markets globally [2].
Smaller TAMs require different strategies compared to larger markets. In regions with a limited user base - say, 500,000 people - you can’t rely on volume alone. Instead, you need higher per-user revenue to make the market worthwhile. On the flip side, massive TAMs like those in India or Southeast Asia allow for ultra-low pricing models, which wouldn't be sustainable in smaller or wealthier markets.
Flexibility is key in price-sensitive regions. Platforms like Google Play and Apple allow developers to fine-tune prices for emerging markets [10]. Some apps even offer micro-transactions as low as $0.11 per day to cater to users with limited budgets [10].
Research backs up the importance of regional pricing. Wappier Research found that publishers earn 20–40% more revenue when pricing is adjusted by country outside the U.S. [2]. Similarly, Xsolla reported an 18.7% boost in payment conversions after introducing regional pricing [2]. These adjustments can make the difference between a market being profitable or overlooked.
Here’s how different market tiers guide pricing strategies:
| Market Tier | Region Examples | Pricing Strategy | Rationale |
|---|---|---|---|
| Tier 1 | U.S., UK, Germany | Maintain or increase by 10–20% | High purchasing power; demand for premium quality |
| Tier 2 | Eastern Europe, Latin America | Reduce by 20–40% | Moderate purchasing power; price-sensitive users |
| Tier 3 | India, Southeast Asia, Africa | Reduce by 50–70% | Low purchasing power; focus on volume-driven revenue |
It’s also important to avoid lumping entire regions together. For example, Latin America is far from uniform - subscriptions in Argentina and Uruguay are significantly pricier than in other countries in the region [11]. Pricing strategies should account for these country-level differences rather than treating regions as monolithic blocks.
TAM size is just one part of the puzzle. Local economic realities add another layer of complexity. While there are around 5.65 billion internet users globally, only about 700 million can easily afford standard Western app pricing [12]. That leaves roughly 4.95 billion potential users who are priced out unless adjustments are made.
Currency fluctuations also play a role. In low-income markets with high inflation or unstable currencies, frequent price updates are necessary to maintain affordability in USD terms [10].
Renderforest is a great example of how addressing these factors can pay off. By localizing prices and reducing issues related to foreign exchange, the company tripled its Annual Recurring Revenue (ARR) and cut refund rates by 60% [2].
"Value isn't universal - it's relative. You're not just competing with other apps, you're competing with the local economy." [3]
Payment methods further influence price sensitivity. In emerging markets, offering localized payment options - like UPI in India or Alipay in China - can help avoid platform fees and allow for deeper discounts without hurting margins [10]. For example, Nexus Mods saw a 9x revenue increase in China after implementing localized checkout and pricing [2].
Ultimately, aligning your pricing model with both TAM size and local economic conditions is critical. While subscription-only models may thrive in high-income markets, price-sensitive regions often require hybrid approaches. These could include combining ads with in-app purchases or offering smaller, more affordable rewards. TAM analysis shouldn’t just dictate how much you charge - it should shape your entire monetization strategy.
TAM insights can help you craft pricing strategies tailored to specific regions. This involves going beyond simple currency conversion and focusing on local purchasing power to set prices that users can afford while still retaining profitability.
To begin, break down your TAM into country-specific segments using three key data points: smartphone penetration, average revenue per user (ARPU), and competitive pricing. With global smartphone penetration expected to reach 80% by 2025 [12], the potential market is growing. However, only a portion of users worldwide can realistically pay Western-standard prices [12].
It’s important to differentiate between currency localization and regional pricing. Currency localization just converts prices into local currencies, like turning $9.99 into ₹830 in India. Regional pricing, on the other hand, adjusts the price itself based on local purchasing power. Netflix is a great example: they charge $4.99 in Ukraine compared to $15.49 in the U.S., reflecting local affordability [12].
Avoid treating entire regions as if they’re uniform. For instance, Latin America has substantial price differences between countries - Argentina and Uruguay require different strategies than Brazil or Mexico. Use the three-tier framework as a starting point but refine it further at the country level. Don’t forget to consider local taxes like VAT, GST, or consumption taxes, which can vary widely. For example, some European nations impose taxes exceeding 19% [4][12].
A key guideline: limit maximum discounts to 60%. Offering deeper discounts might undermine your brand’s perceived value and alienate premium users, potentially harming trust and retention over time [12].
Once you’ve segmented your TAM and gathered the necessary data, automating pricing adjustments becomes essential to ensure accuracy and efficiency.
Managing pricing for over 175 countries manually is nearly impossible due to constant changes in currency rates, taxes, and competition. That’s where automated tools like Mirava (https://mirava.io) come in. Mirava simplifies regional pricing adjustments by leveraging purchasing power parity (PPP) calculations, enabling batch updates, and offering revenue impact previews.
Here’s how Mirava works: it uses PPP and custom indices for app subscriptions to recommend optimal prices for each country. Instead of manually tweaking prices in App Store Connect or Google Play Console, you can update hundreds of prices with a single click. The platform also provides revenue and conversion impact previews, so you can assess potential outcomes before implementing changes. This minimizes guesswork and avoids costly errors.
Companies that embrace PPP-based regional pricing often see impressive results. For example, businesses report revenue increases ranging from 15% to 122% in the first month of implementation [12]. Research from Wappier shows publishers can earn 20%-40% more revenue by fine-tuning prices at a country level outside the U.S. [2]. Additionally, a study of 457 SaaS companies revealed 11% month-over-month growth for those adopting localized pricing strategies [2].
"Localized pricing drives a corresponding increase in revenue. At wappier, we've seen publishers earn 20%-40% more revenue by adjusting prices on per country level outside the US." [2]
Mirava also includes features like A/B testing guidance, tools for team collaboration, and compliance-safe automation to prevent risky practices like scraping. For smaller developers, the Basic plan is free and supports up to 2 apps. The Professional plan, at $25/month (billed annually), unlocks advanced PPP features and batch pricing updates. Larger publishers can opt for the Agency plan, which offers unlimited app support and API access.
The real benefit of tools like Mirava is the combination of speed and precision. Manual pricing adjustments are time-consuming and prone to mistakes, often taking hours or days to complete. Automated tools cut this down to minutes, ensuring prices are optimized for affordability and profitability. This is particularly crucial in low-PPP regions, where setting a minimum price floor helps protect margins even when offering steep discounts [2].
Transforming your Total Addressable Market (TAM) analysis and regional insights into effective pricing strategies involves breaking your market into layers, experimenting with pricing, and continuously refining based on performance.
Start by defining three essential market layers:
To calculate TAM, use this bottom-up formula: potential users × % paying × net ARPU × 12 [8]. For SAM, exclude regions where you're not active and adjust for local payment preferences, like wallets or credit cards.
Set a baseline price using Purchasing Power Parity (PPP) data from reliable sources like the World Bank or OECD. For example, if your base price is $9.99, adjust it for each region's economic conditions. Segment your markets into tiers and apply discounts accordingly:
Test pricing with A/B experiments in each region. Use three variants: the PPP-based baseline, a 20% premium, and a 20% discount. This helps you find the sweet spot between affordability and profitability. Track Revenue Per User (RPU) as your main metric to evaluate success. Regional pricing strategies can boost total revenue by 22–35%, with localized approaches sometimes driving up to a ninefold increase [13][2].
For regions with high currency volatility (over 15%), update pricing quarterly. For TAM-wide adjustments, an annual review is generally sufficient, though you should revisit your SAM whenever you expand platforms or payment options [8]. Pricing isn’t static - keep adapting as your market evolves.
As your pricing strategy takes shape, remain flexible. Market dynamics like new technologies, regulatory shifts, or changing customer behaviors can all reshape your TAM [14]. Reassess your market sizing and pricing when launching new products, entering new regions, expanding platforms, or making significant business shifts [1][15]. For example, moving from iOS-only to Android or adding new languages will require updated pricing for those segments [1].
Keep an eye on your unit economics, ensuring your Customer Acquisition Cost (CAC) stays below one-third of your Lifetime Value (LTV) [1]. As your market matures, consider adopting usage-based or hybrid pricing models. These models have shown to deliver a 54% revenue premium for public SaaS companies compared to traditional models [16].
Take Algolia as an example: in 2019, they moved back to a usage-based pricing model after years of feature-gating, dedicating nearly a year to redesign their billing systems to better serve developers. Similarly, New Relic transitioned to usage-based pricing in 2020, which helped reverse a decline in account growth [16].
"Pricing changes are always risky, but the risk-to-reward ratio of usage-based pricing is asymmetric – which is likely what makes monetization the most effective growth pillar." – Austin Yang, Former Lead Product Manager, Landbot [16]
Build new price points using real sales data and customer feedback rather than relying solely on general industry reports [1][15]. Streamlining payment systems - such as shifting transactions to your website - can also recover up to 30% of revenue lost to platform fees, further expanding your SOM [8].
Total Addressable Market (TAM) analysis plays a crucial role in pricing strategies, offering the potential to unlock 15% to 122% revenue growth within the first month of implementation [12]. By segmenting your TAM geographically and aligning prices with local purchasing power, you can capture untapped opportunities in affluent markets while also making your products accessible to the 4.95 billion internet users often excluded by standard Western pricing models [12].
The real takeaway is that pricing isn’t a one-time decision - it’s an ongoing, data-driven process. Companies that regularly reassess their pricing strategies based on TAM, SAM, and SOM data have seen 12-40% year-over-year revenue growth [17]. This requires staying attuned to shifts in market conditions, currency values, and competitive landscapes.
Mirava streamlines this complex process by automating purchasing power parity (PPP) calculations and synchronizing prices across iOS, Android, and Web platforms in real-time. Instead of manually tracking data and updating prices for hundreds of regions, Mirava allows you to preview revenue impacts, conduct A/B tests, and deploy batch updates across more than 175 countries in just minutes. This efficiency ensures that your TAM-based pricing strategy remains agile and competitive.
The key difference between basic currency localization and true regional pricing lies in moving from surface-level adjustments to a thoughtful, strategic approach. As Zoë Castillo from Mirava explains:
"Fixed global pricing signals economic tone-deafness" [12].
By aligning your pricing with the economic realities of each market, you can turn previously overlooked regions into thriving revenue drivers while maximizing profits in premium markets. TAM analysis transforms pricing from a static figure into a dynamic tool for growth.
Start by analyzing your TAM, segment it geographically, and adapt as markets shift. Success isn’t just about having innovative features - it’s about making your value accessible to the right audience at the right price.
To estimate your TAM before launching, you’ll need to dive into market research and choose between two main approaches: top-down or bottom-up.
Whichever method you choose, it’s also helpful to use tools to fine-tune your pricing strategies. This ensures your estimates align with current market conditions and help you make informed decisions.
The quickest way to turn TAM data into region-specific pricing is by leveraging Purchasing Power Parity (PPP). Start with a base price in USD, then adjust it using PPP figures from trusted sources such as the World Bank. From there, apply multipliers to account for local purchasing power differences. Tools like Mirava can streamline this process, helping you create fair and competitive pricing for each market while saving time and boosting revenue potential.
Keeping regional prices up-to-date is key to staying competitive. It's a good idea to review prices monthly and make adjustments every 30 to 90 days. This routine helps account for changes in currency values, shifts in local purchasing power, and evolving market trends. By doing so, you can ensure your pricing strategy remains relevant and supports your revenue goals.