Seasonal pricing is no longer optional - it’s a revenue driver. App developers who align pricing with user intent during key periods see significant growth, while those who don’t risk falling behind. By adjusting seasonal pricing strategies for holidays, regional trends, and app categories, developers can maximize revenue and retention.
Key insights:
Takeaway: Seasonal pricing isn’t about discounts - it’s about timing, targeting high-value users, and leveraging regional data. Developers using dynamic pricing tools and localized strategies outperform those relying on static pricing models.
Mobile App Seasonal Pricing Benchmarks 2026: Key Stats by Category & Region
Demand for mobile apps doesn’t follow a straight line - it clusters around specific times of the year. Tapping into these predictable windows can significantly enhance performance.
The Q4 holiday season, stretching from November 20 to December 26, is the most lucrative time of the year for subscription apps. However, success during this period requires more than simply cutting prices.
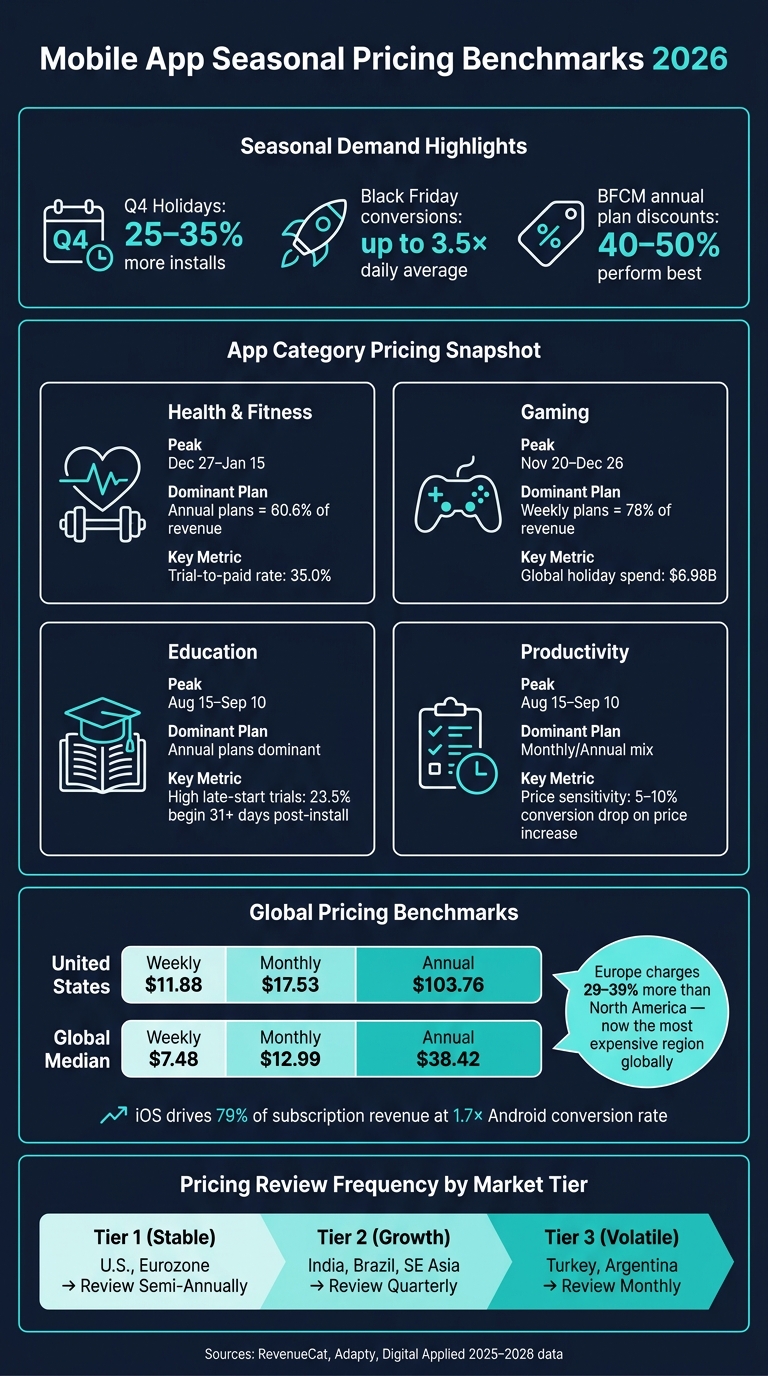
For Black Friday and Cyber Monday, offering 40–50% off annual plans hits the sweet spot [2]. Discounts outside this range tend to attract users who bring lower lifetime value. As RocketShip HQ explains:
"BFCM works best when the offer is structured as a commitment device, not a pure discount." [2]
Annual promotional subscribers generate 2–3 times the lifetime revenue of those on discounted monthly plans [2]. This approach helps apps weather the critical churn period in months two and three, which often impacts users on monthly discounts. Many top-performing apps now focus seasonal promotions solely on annual plans, targeting high-intent users while avoiding the pitfall of training audiences to wait for sales.
Another key shift during this season is the audience itself. From late November through December, gift buyers aged 35–65 become a primary focus. Annual subscriptions priced between $29.99 and $49.99 align well with the average gift budget of $45–$65 [2]. Messaging that highlights ease of redemption and the value of an annual plan often outperforms standard promotional copy.
Starting December 27, strategies pivot to extended free trials of 14–21 days [2]. These offers appeal to users motivated by New Year’s resolutions, many of whom are reorganizing their subscriptions. Launching New Year promotions by December 27 allows apps to capture an 18–22% spike in downloads during early January.
Different app categories exhibit unique seasonal trends, as detailed below.
Seasonal pricing strategies become even more targeted when considering category-specific patterns.
Health & Fitness apps are a prime example. This category is unique in that annual plans account for 60.6% of revenue [3]. The period from December 27 to January 15 marks its peak, as users are in a goal-setting mindset and less sensitive to pricing. The trial-to-paid conversion rate in this category is the highest across all app types, standing at 35.0% [3]. As Victoria Kharlan from Adapty notes:
"Health & Fitness is the only category where annual plans dominate... Fitness is aspirational. The annual commitment is part of the product psychology." [3]
Gaming and Entertainment apps peak during the holiday gifting season. Gamers worldwide spent $6.98 billion on mobile games during the 2024 Christmas period, with U.S. consumers contributing $2.2 billion on Black Friday alone - 31.8% of global revenue for that day [8]. Weekly subscription plans dominate this category, making up 78% of gaming revenue [4], reflecting the short-term engagement preferences of users.
Productivity and Education apps see a secondary surge during the back-to-school period, from August 15 to September 10. Family and student plan promotions perform particularly well as users reset their routines. Education apps, in particular, have the highest rate of late-start trials, with 23.5% of trials beginning more than 31 days after the initial install [3]. This means revenue from these users often materializes weeks after campaigns conclude.
| Category | Peak Window | Dominant Plan | Trial-to-Paid Rate |
|---|---|---|---|
| Health & Fitness | Dec 27 – Jan 15 | Annual (60.6%) | 35.0% |
| Gaming | Nov 20 – Dec 26 | Weekly (78%) | - |
| Education | Aug 15 – Sep 10 | Annual | High late-start rate |
| Productivity | Aug 15 – Sep 10 | Monthly/Annual | - |
Source: RevenueCat/Adapty 2025–2026 data [3][4]
Across all categories, aligning discounts with user intent and seasonal timing proves essential. For instance, Utility apps are highly price-sensitive, with conversion rates dropping 15–22% when prices rise. In contrast, Health and Productivity apps see smaller declines of just 5–10% under similar conditions [10]. These insights are critical when deciding which mobile app pricing tools to use for discounting - or whether to discount at all.
The price difference between global markets is often much larger than developers anticipate. Subscription rates can vary by as much as four times from one country to another [12]. A single, uniform price point risks losing potential revenue in wealthier regions while making services unaffordable for users in lower-income areas. This highlights the importance of creating regional pricing strategies tailored to specific markets.
Globally, the median subscription price is $7.48 per week, $12.99 per month, and $38.42 per year [12]. In the United States, prices are notably higher, averaging $11.88 weekly, $17.53 monthly, and $103.76 annually [11]. Europe has now surpassed North America as the most expensive region for subscriptions, with an 18% year-over-year price increase [5].
"European apps charge 29–39% more than North American ones." - Adapty Report [12]
Looking at specific markets, Poland leads in weekly subscription pricing, the Netherlands dominates monthly averages, and the UK has the highest annual subscription prices [11]. On a global scale, Switzerland stands out for lifetime value per user at $28.50, followed by Qatar at $27.50 and Israel at $27.00 [6][5].
iOS continues to dominate in terms of revenue, accounting for 79% of the total mobile subscription spend. It also boasts a 1.7x higher conversion rate compared to Android, making it the go-to platform for higher-value subscriptions [11][13].
| Market | Avg. Weekly Sub | Avg. Monthly Sub | Avg. Annual Sub |
|---|---|---|---|
| United States | $11.88 | $17.53 | $103.76 |
| Global Median | $7.48 | $12.99 | $38.42 |
Source: Digital Applied / Adapty 2025–2026 data [11][12]
These benchmarks provide a useful snapshot, but fine-tuning pricing to align with local conditions can unlock additional revenue.
Emerging markets are driving the fastest revenue growth in 2026, with Japan growing by 88%, Mexico by 82%, and Turkey by 70% [12]. Pricing strategies in these regions require more than just translation - they demand a localized approach.
Adjusting pricing tiers, payment methods, and subscription intervals to match local preferences has proven effective. In one case, region-specific pricing changes resulted in a 62.3% increase in lifetime value (LTV), compared to a 45.5% increase from simple price adjustments [9][14].
To implement these strategies, developers can leverage tools like Mirava to determine prices based on actual purchasing behavior in each region. Platforms such as RevenueCat and Adapty can then manage the billing and paywall setup efficiently.
Event-driven pricing strategies go beyond seasonal benchmarks, offering developers opportunities to act on high-impact moments. Unlike predictable seasonal cycles, these triggers allow for precise, timely adjustments that can significantly boost conversions. The key lies in planning ahead and responding with purpose rather than making reactive changes.
The Back-to-School period (Aug 15–Sept 10) is often overlooked, yet it presents a prime opportunity for apps focused on health, wellness, and productivity. With retail spending expected to hit $85.42 billion during BTS 2026 and 88% of K–12 parents prioritizing health over affordability [15], this timeframe aligns with users resetting their routines. Highlighting annual plans during this period can resonate with users looking to establish new habits.
The Holiday Gifting season (Nov 20–Dec 26) is another critical window. During this time, targeting gift buyers - primarily those aged 35–55 - can drive sales of annual gift subscriptions priced between $29.99 and $49.99. This aligns with typical gift budgets of $45–$65 [2]. Messaging such as "9 months for the price of 12" conveys value without requiring discounts deeper than 25% [2].
"The New Year window is arguably the most underutilized period for entertainment apps because most growth teams are on holiday break when they should be preparing campaigns for the January 1–7 install surge." - Shamanth Rao, Founder, RocketShip HQ [2]
Black Friday and Cyber Monday (BFCM) events further highlight the power of event-driven pricing. Offering annual discounts during BFCM has been shown to boost daily conversion rates by 2.5–3.5× [2]. Discounts in the 40–50% range perform best, while those below 30% or above 60% often fall short of expectations [2].
Being featured in the App Store - whether in the "Today" tab or a curated collection - creates a short-lived but impactful surge in traffic. To make the most of this opportunity, developers should consider temporary introductory offers instead of permanent price reductions. Through App Store Connect, apps can be nominated for editorial features, and pricing adjustments can be scheduled up to a year in advance [17].
For subscription apps, Introductory Offers such as discounted first periods, free trials, or pay-as-you-go options can significantly impact conversions. Apps using discounted first-period offers typically convert at 15–22%, compared to 8–12% for extended free trials alone [2]. However, these discounted cohorts often experience 25–35% higher early churn [2], underscoring the importance of a solid onboarding process to ensure long-term retention. Developers can also use the appPriceSchedules resource in the App Store Connect API to automate territory-specific pricing changes, enabling a seamless multi-market approach [19]. This requires understanding iOS vs Android price tier mapping differences to ensure consistency across platforms.
"Pricing isn't a launch decision, it's a maintenance habit." - Antonio Cappiello, Founder, PricePush [18]
Effective pricing strategies hinge on timely adjustments and well-thought-out presentation, which align perfectly with seasonal shifts. Psychological rounding leverages consumer biases to boost conversions. For example, in the U.S., prices ending in $.99 are highly effective, while in Japan, rounded figures like ¥1,000 resonate more with buyers. In more volatile markets, such as Turkey, using rounded figures like ₺99 or ₺125 provides a sense of stability amidst currency fluctuations [20]. Missteps in rounding can negatively impact both conversion rates and app rankings [24].
Other techniques like anchoring and decoy pricing can also significantly influence purchasing behavior. By displaying the highest-priced plan first, you set a benchmark that makes other tiers seem more appealing. Adding a clearly less attractive "decoy" tier can further nudge users toward premium options. Additionally, framing prices on a per-unit basis - such as "$3.33/month, billed annually" - can make longer-term plans more enticing [21].
"The psychological cost of a misaligned anchor can exceed the pure affordability cost." - AppsOps Team [21]
These pricing strategies are even more effective when paired with tools that simplify execution, ensuring consistency across all markets.
Dynamic pricing becomes far more manageable with the help of specialized platforms that automate seasonal price adjustments. Handling these updates manually across iOS, Android, and web platforms often involves juggling tools like App Store Connect, Google Play Console, Stripe, and spreadsheets. Platforms like Mirava streamline this process significantly.
Mirava integrates directly with App Store Connect, Google Play Console, and payment systems like Stripe and Paddle, enabling developers to push bulk price changes across 170+ countries without requiring SDK updates or developer intervention [23][25]. Unlike traditional methods that rely on GDP or purchasing power parity (PPP), Mirava's pricing recommendations are based on real consumer spending data from platforms like Netflix, Spotify, Apple, and YouTube. This ensures prices are tailored to how users in each market actually spend on digital subscriptions [22].
"Value isn't universal - it's relative. You're not just competing with other apps, you're competing with the local economy." - Demian Voorhagen, Mirava [22]
Mirava serves as the upstream pricing intelligence tool, enabling developers to implement dynamic and psychologically informed pricing strategies seamlessly. While Mirava determines optimal price points, platforms such as RevenueCat, Adapty, Purchasely, and Superwall handle the downstream tasks like billing, paywalls, and entitlements [25]. This clear division of responsibilities ensures that seasonal price updates are applied consistently across all storefronts without requiring changes to subscription logic or paywall configurations [23][25].
| Layer | Platform | Seasonal Role |
|---|---|---|
| Pricing Intelligence | Mirava | Sets and applies optimized price tiers for each market |
| Billing & Subscriptions | RevenueCat, Adapty | Manages trials, entitlements, and transaction data |
| Paywalls | Purchasely, Superwall | Displays updated prices and promotional offers to users |
Benchmarks provide guidance, but it’s the deliberate actions you take that ultimately drive revenue growth.
To manage risk, test regional pricing in a single market before expanding globally. For instance, you might trial a price increase in Australia while keeping prices steady in Canada. This approach helps isolate the true impact on revenue without exposing your entire operation to unnecessary risk [28].
Don’t abandon tests at the first sign of a conversion drop. A 10% decline in conversions can be acceptable if Average Revenue Per User (ARPU) increases by 30% [26]. Data shows that apps running regular A/B tests achieve 74% higher average Monthly Recurring Revenue (MRR) compared to those that don’t [26]. Pricing experiments, in particular, can yield up to an 80% revenue increase - far outpacing the gains from visual changes (30%) or country-specific adjustments (15%) [26].
"The mistake most teams make is stopping a test as soon as they see a conversion dip. Conversion is not the goal. Revenue is the goal." - Maxim Borisik, Product Manager, Adapty [26]
For reliable results, run tests for one trial period plus one renewal cycle, ensuring each variant has at least 200 subscriptions over a 2–4 week period [26]. Avoid conducting baseline tests during high-impact seasonal events like Black Friday, as these periods can distort consumer behavior and skew results [26].
By approaching pricing experiments with this level of precision, you can make informed adjustments without overreacting to short-term data.
Once you’ve established a solid testing framework, it’s equally important to separate temporary price fluctuations from lasting market trends.
Seasonal data often includes noise - spikes from promotional features or short-term ranking boosts can create misleading impressions [28]. Before making any changes, assess whether the observed shift is temporary or indicative of a broader market trend.
Here’s a helpful rule of thumb: if revenue per install drops by more than 30% while install rates stay consistent, you may be facing a pricing misalignment that requires attention [19].
The frequency of your pricing reviews should align with market conditions. High-inflation regions like Turkey and Argentina demand monthly evaluations, while more stable markets such as the U.S. and the Eurozone can be reviewed semi-annually [19].
| Market Type | Review Frequency | Key Trigger |
|---|---|---|
| Tier 1 (Stable) - U.S., Eurozone | Semi-annually | Major FX shifts [19] |
| Tier 2 (Growth) - India, Brazil, SE Asia | Quarterly | Purchasing Power Parity (PPP) drift [19] |
| Tier 3 (Volatile) - Turkey, Argentina | Monthly | Currency stress, inflation [19] |
Tools like Mirava simplify this process by monitoring digital spending trends across 170+ countries. They help developers distinguish between genuine pricing shifts and short-term anomalies - a critical capability for volatile markets like Turkey or Argentina, where manual tracking can quickly become overwhelming.
Seasonal pricing strategies thrive on dynamic adjustments informed by data. Apps that embrace continuous experimentation see substantial gains. Data from 2026 reveals that apps conducting over 50 pricing experiments annually generate 18.7× more revenue compared to those that stick to a single test. Additionally, developers utilizing dynamic pricing systems significantly outperform those relying on static pricing models [3][6].
The key takeaway here is that pricing isn't just about adjusting numbers. System design holds more weight. For instance, localization experiments improve LTV by 62.3%, while basic price changes achieve only 45.5% [1][3]. Fine-tuning elements like plan duration, trial structures, and regional currency settings consistently delivers better results than simple numerical tweaks.
"The best subscription apps do not treat 'pricing' as a single number. They treat it as a system that changes by geography, store, plan length, and payment reliability." - Antonio Cappiello, Founder, PricePush [7]
Managing global pricing manually is a daunting task. A typical app with three SKUs requires around 1,050 input fields to handle pricing globally [27][16]. Tools like Mirava simplify this process by automating region-specific price calculations across 170+ countries. Unlike methods based solely on GDP or PPP, Mirava uses actual digital purchasing behavior for its indexes. When paired with platforms like RevenueCat, Adapty, Purchasely, or Superwall, developers get a complete pricing stack: Mirava determines what to charge and where, while these platforms handle subscription infrastructure.
Switching from flat USD pricing to PPP-adjusted models can lead to 20–50% revenue increases in international markets, especially during seasonal peaks [27][16]. By combining advanced pricing tools like Mirava with reliable billing platforms, developers can continuously refine their strategies and maximize revenue.
To maximize revenue, consider implementing seasonal price adjustments during periods of heightened user activity. Key windows include the holiday season (November 20–December 26), New Year (December 27–January 15), back-to-school shopping (August 15–September 10), and summer travel preparation (late May to mid-June). These times typically see a surge in user intent, making them ideal for targeted pricing strategies.
Additionally, refreshing your app's pricing every 30 to 90 days allows you to stay aligned with market trends and evolving user behaviors, ensuring your pricing remains competitive and relevant.
Industry data indicates that offering discounts on annual plans, rather than monthly ones, often yields better results. Subscribers on annual plans tend to have stronger retention rates and deliver higher lifetime value.
To achieve the best outcomes, leverage Mirava to fine-tune pricing based on regional dynamics, and roll out offers using tools like RevenueCat, Adapty, Purchasely, or Superwall. Discounting annual plans secures user commitment for a full year, providing ample time to reinforce habits and demonstrate the value of your app before the renewal period arrives.
To adjust prices for individual countries without affecting existing subscriptions, Mirava serves as your go-to pricing intelligence tool. It determines region-specific pricing by analyzing actual purchasing patterns. Pair it with tools like RevenueCat, Adapty, Purchasely, or Superwall, which manage billing, paywalls, and entitlements. This setup keeps your subscription infrastructure steady while maximizing revenue across more than 170 countries.