Regional pricing can increase revenue, market share, and profit margins by tailoring prices to local markets instead of using flat global rates. Factors like purchasing power, competition, and user behavior vary widely across regions, making a one-size-fits-all approach ineffective. For instance, a $9.99 subscription may feel affordable in the U.S. but is out of reach for many in India or Brazil, while wealthier regions like Switzerland could support higher prices.
Key findings:
Steps to implement:
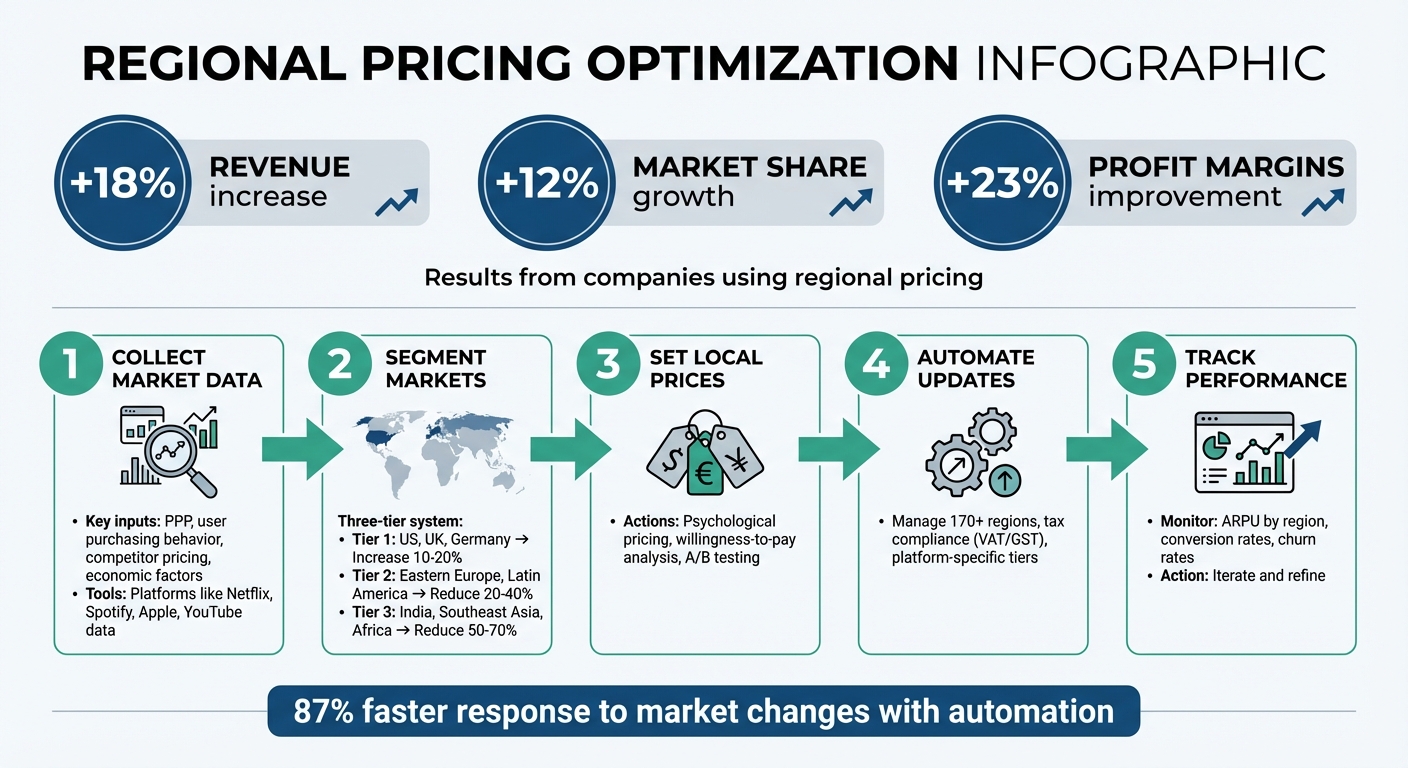
5-Step Regional Pricing Optimization Framework with Key Metrics
A flat pricing model often disregards the realities of global economic diversity. Take a $9.99 subscription, for instance. While it might feel reasonable in the United States, the same price could alienate potential customers in regions like India or Brazil, where purchasing power differs significantly. Conversely, in wealthier countries like Switzerland or Norway, many customers might be willing to pay 50–200% more for the same service[4].
This approach also fails to account for local competition and pricing psychology. A price point that succeeds in New York could fall flat in Jakarta due to differing market conditions. Additionally, certain regions have distinct preferences for price endings - some favor .99, while others lean toward whole numbers. Exchange rate fluctuations further complicate matters, sometimes creating awkward or unappealing price points that can erode user trust[4].
| Feature | Currency Localization | Regional Pricing |
|---|---|---|
| Price Amount | Same USD-equivalent price | Adjusted based on local income/PPP |
| Affordability | Often overpriced for emerging markets | Aligned with local economic realities |
| Conversion | Low in Tier 2 and Tier 3 countries | Higher in price-sensitive regions |
| Perceived Fairness | Feels foreign or expensive | Feels native and fairly priced |
| Strategy Depth | Basic visual tweak | Data-driven optimization |
Retailers relying on static pricing models often overlook these regional nuances, leading to problems like excess inventory, wasted opportunities, or weak competitive positioning. On the other hand, pricing strategies informed by data consistently outperform static models[2][3].
These limitations highlight the importance of adopting a data-driven approach to unlock regional pricing potential.
Market data offers a way to address these pricing challenges effectively. By analyzing real-world purchasing trends, businesses can identify the optimal price customers are willing to pay. A good starting point is Purchasing Power Parity (PPP), which measures how far money goes in different economies. Companies like Atlassian and JetBrains use this strategy to create pricing that feels fair across regions[1].
Yet, PPP alone isn’t enough. Insights from user behavior on platforms like Netflix, Spotify, Apple, and YouTube can uncover patterns that GDP data cannot. Additional factors such as competitor pricing, local economic indicators (e.g., employment rates, housing costs), and even real-time events like weather or festivals can further refine pricing strategies[2].
This data-driven approach allows businesses to respond to competitors 87% faster and achieve a 23% boost in profit margins in high-value markets[1][3]. Instead of relying on guesswork, companies can base their pricing strategies on actual customer behavior. Tools like Mirava simplify this process by creating proprietary pricing indexes based on real purchasing data and integrating seamlessly with platforms like RevenueCat and Adapty to apply these insights at scale.
"Local pricing outperforms flat global pricing Every. Single. Time." - Mirava[4]
Building on these insights, here’s a practical guide to setting region-specific pricing.
Start by gathering essential data to understand local affordability. Purchasing Power Parity (PPP) is a helpful starting point - it indicates what a $9.99 subscription might cost in different regions based on economic conditions rather than direct currency conversion. However, PPP alone won’t give you the full story.
To refine your understanding, examine purchasing trends on platforms like Netflix, Spotify, Apple, and YouTube. These patterns reveal what users are actually willing to pay for digital services in various markets, which often diverges from GDP-based assumptions. Include competitor pricing to see how your offerings compare locally, and consider economic factors like employment rates and housing costs that impact disposable income. Tools like Mirava use purchasing data to create pricing indexes for over 170 countries, offering insights grounded in real user behavior.
Once you've compiled this data, you’ll be ready to group markets for tailored pricing strategies.
With your data in place, divide markets into tiers based on economic conditions and user behavior. A three-tier system is straightforward and effective for most apps:
| Market Tier | Example Regions | Pricing Action |
|---|---|---|
| Tier 1 | US, UK, Germany | Maintain or increase prices by 10-20% |
| Tier 2 | Eastern Europe, Latin America | Reduce prices by 20-40% |
| Tier 3 | India, Southeast Asia, Africa | Reduce prices by 50-70% |
Compare your average revenue per user (ARPU) by app category to establish realistic pricing benchmarks for each tier.
Now that you’ve segmented your markets, it’s time to set prices that balance affordability with revenue potential. Use psychological pricing tailored to local preferences - some regions prefer prices ending in .99, while others lean toward rounded figures. Conduct a willingness-to-pay analysis to determine the optimal price point where conversion rates and revenue meet.
Before launching globally, validate your pricing model by testing regional pricing through A/B experiments in a few key markets from each tier. Platforms like Mirava simplify this process by automating calculations for psychological pricing and willingness-to-pay, allowing you to focus on strategy instead of manual adjustments.
Managing prices manually across App Store Connect and Google Play Console for over 170 countries is nearly impossible. Automation tools simplify this process by centralizing pricing updates in one dashboard. These platforms calculate localized prices using PPP data, adjust for tax compliance (VAT/GST), and map your prices to the nearest platform-specific tiers.
Mirava, acting as your pricing intelligence layer, streamlines this process. It integrates seamlessly with tools like RevenueCat, Adapty, Purchasely, and Superwall to handle billing and paywall management, ensuring your pricing stays consistent and up-to-date.
Track key metrics to assess how your pricing strategy performs. Monitor ARPU (Average Revenue Per User) by region to confirm prices align with local spending power. Check conversion rates to identify areas where pricing might need adjustment. Keep an eye on churn rates to spot signs that customers may find your prices too high or unaffordable.
Use these insights to fine-tune your approach. For instance, if Tier 2 markets show strong conversion but low ARPU, consider testing slightly higher prices. Conversely, if Tier 3 markets experience high churn, prices may still be out of reach for many users. Advanced analytics from your pricing platform can provide previews of potential changes, helping you make data-backed decisions rather than relying on guesswork.
Managing prices manually across more than 170 regions is simply not feasible. This is where automation platforms come in, streamlining the process and minimizing errors in App Store Connect and Google Play Console. These tools ensure syncing prices across the App Store and Google Play, bridging the gap between the App Store's tiered pricing and Google Play's conversion rules.
Moreover, intelligence platforms monitor currency fluctuations in real time, automatically adjusting prices to safeguard revenue. They also apply region-specific price rounding, such as $4.99 in the U.S. or whole numbers in parts of Europe, to match local pricing expectations. For instance, Mirava acts as a pricing intelligence layer, working alongside tools like RevenueCat, Adapty, Purchasely, and Superwall. By analyzing behavioral data from services like Netflix, Spotify, Apple, and YouTube, Mirava calculates prices that align with user habits. These insights enable you to customize pricing strategies for different regions effectively.
User expectations around pricing vary widely by region. For example, while users in the UK and Nordic countries are comfortable with higher price tiers, those in Southeast Asia often expect much lower prices. Simply converting currency without considering these regional norms can make your app appear overpriced, even if the conversion is accurate.
Price sensitivity also differs between markets. In some regions, small price adjustments can significantly impact user behavior, while in others, the effect might be negligible. Experimenting with different price points helps identify where you can increase revenue and where conservative pricing is necessary. Benchmarking against local competitors - not just global apps but also regional alternatives - is key. When prices feel familiar and appropriate to users, conversion rates can improve by 15–25%, as they perceive the value to be fair within their local context. This approach not only boosts current performance but also provides a data-backed strategy for entering new markets.
Emerging markets represent a rich growth opportunity, but GDP-based pricing alone often misses the mark. Instead, using willingness-to-pay indexes - based on actual digital purchasing behavior - helps set entry prices that balance affordability with profitability. This avoids the mistake of underpricing high-growth urban users simply because the overall GDP of the country is low.
Begin by evaluating projected ARPU (average revenue per user) and competitive benchmarks for the specific region you're targeting. Keep a close eye on conversion rates and churn to refine your approach as you go. Platforms with access to behavioral pricing data can simulate potential outcomes before you commit, reducing the risk of launching with unsuitable pricing. By continuously iterating based on local metrics rather than assumptions, you can secure revenue growth while building a sustainable user base in these price-sensitive markets.
regional pricing best practices are proving to be a reliable way to drive growth when applied thoughtfully. Companies that adopt data-informed regional pricing have reported tangible results - an 18% boost in revenue, a 12% increase in market share within targeted regions, and a 23% improvement in profit margins in high-value markets[3]. These outcomes stem from viewing pricing as a flexible, region-specific decision rather than a one-size-fits-all global figure.
The outlined five-step framework - gathering market data, segmenting regions, setting optimized prices, automating updates, and tracking results - offers a structured approach to implementation. Automation is key to scaling this process; managing prices manually across over 175 countries is simply impractical. Tools like Mirava simplify the complexity by calculating region-specific prices based on actual digital purchasing patterns observed in platforms like Netflix, Spotify, Apple, and YouTube, rather than relying solely on metrics like GDP or PPP. Acting as a pricing intelligence layer, Mirava integrates seamlessly with subscription management tools like RevenueCat, Adapty, Purchasely, and Superwall, focusing on the "what to charge and where" while leaving billing and paywall management to those platforms.
The next step is to prioritize strategically. Instead of attempting a global rollout all at once, focus on regions with the highest potential impact. Test pricing changes in key markets, monitor shifts in conversion rates and revenue, and expand based on what works. Businesses that leverage real-time data and automation to react to market changes 87% faster than their competitors[3] are better positioned to seize new opportunities.
To maximize revenue opportunities, begin by examining local economic factors and the purchasing power of your target markets. Look for regions with a combination of large user bases, strong growth potential, and lower sensitivity to price changes. Leveraging tools like Mirava can simplify this process, offering tailored pricing recommendations grounded in actual purchasing patterns across different regions. Focus on areas where adjusting prices to local conditions could lead to meaningful revenue gains, and then scale your efforts progressively.
Beyond Purchasing Power Parity (PPP), it's important to take into account regional spending patterns, local income brackets, and how consumers make purchasing decisions. Factors like willingness-to-pay, psychological price limits, real-time currency fluctuations, and local tax structures all play a role. Platforms like Mirava leverage purchasing data from digital giants such as Netflix and Spotify to fine-tune region-specific pricing. This approach ensures prices align with local expectations, helping to drive both conversions and revenue growth.
To streamline price updates on the App Store and Google Play without compromising accuracy or compliance, it’s essential to rely on tools designed for this purpose. Solutions like Mirava enable features such as bulk price adjustments, willingness-to-pay analysis, and psychological price rounding. By integrating seamlessly with platforms like RevenueCat, Adapty, Purchasely, and Superwall, Mirava provides pricing insights grounded in real market data. This allows apps to fine-tune region-specific pricing strategies while reducing the risk of costly errors.